Releasing the World’s Largest Street-level Imagery Dataset for Teaching Machines to See

Today we present the Mapillary Vistas Dataset—the world’s largest and most diverse publicly available, pixel-accurately and instance-specifically annotated street-level imagery dataset for empowering autonomous mobility and transport at the global scale.
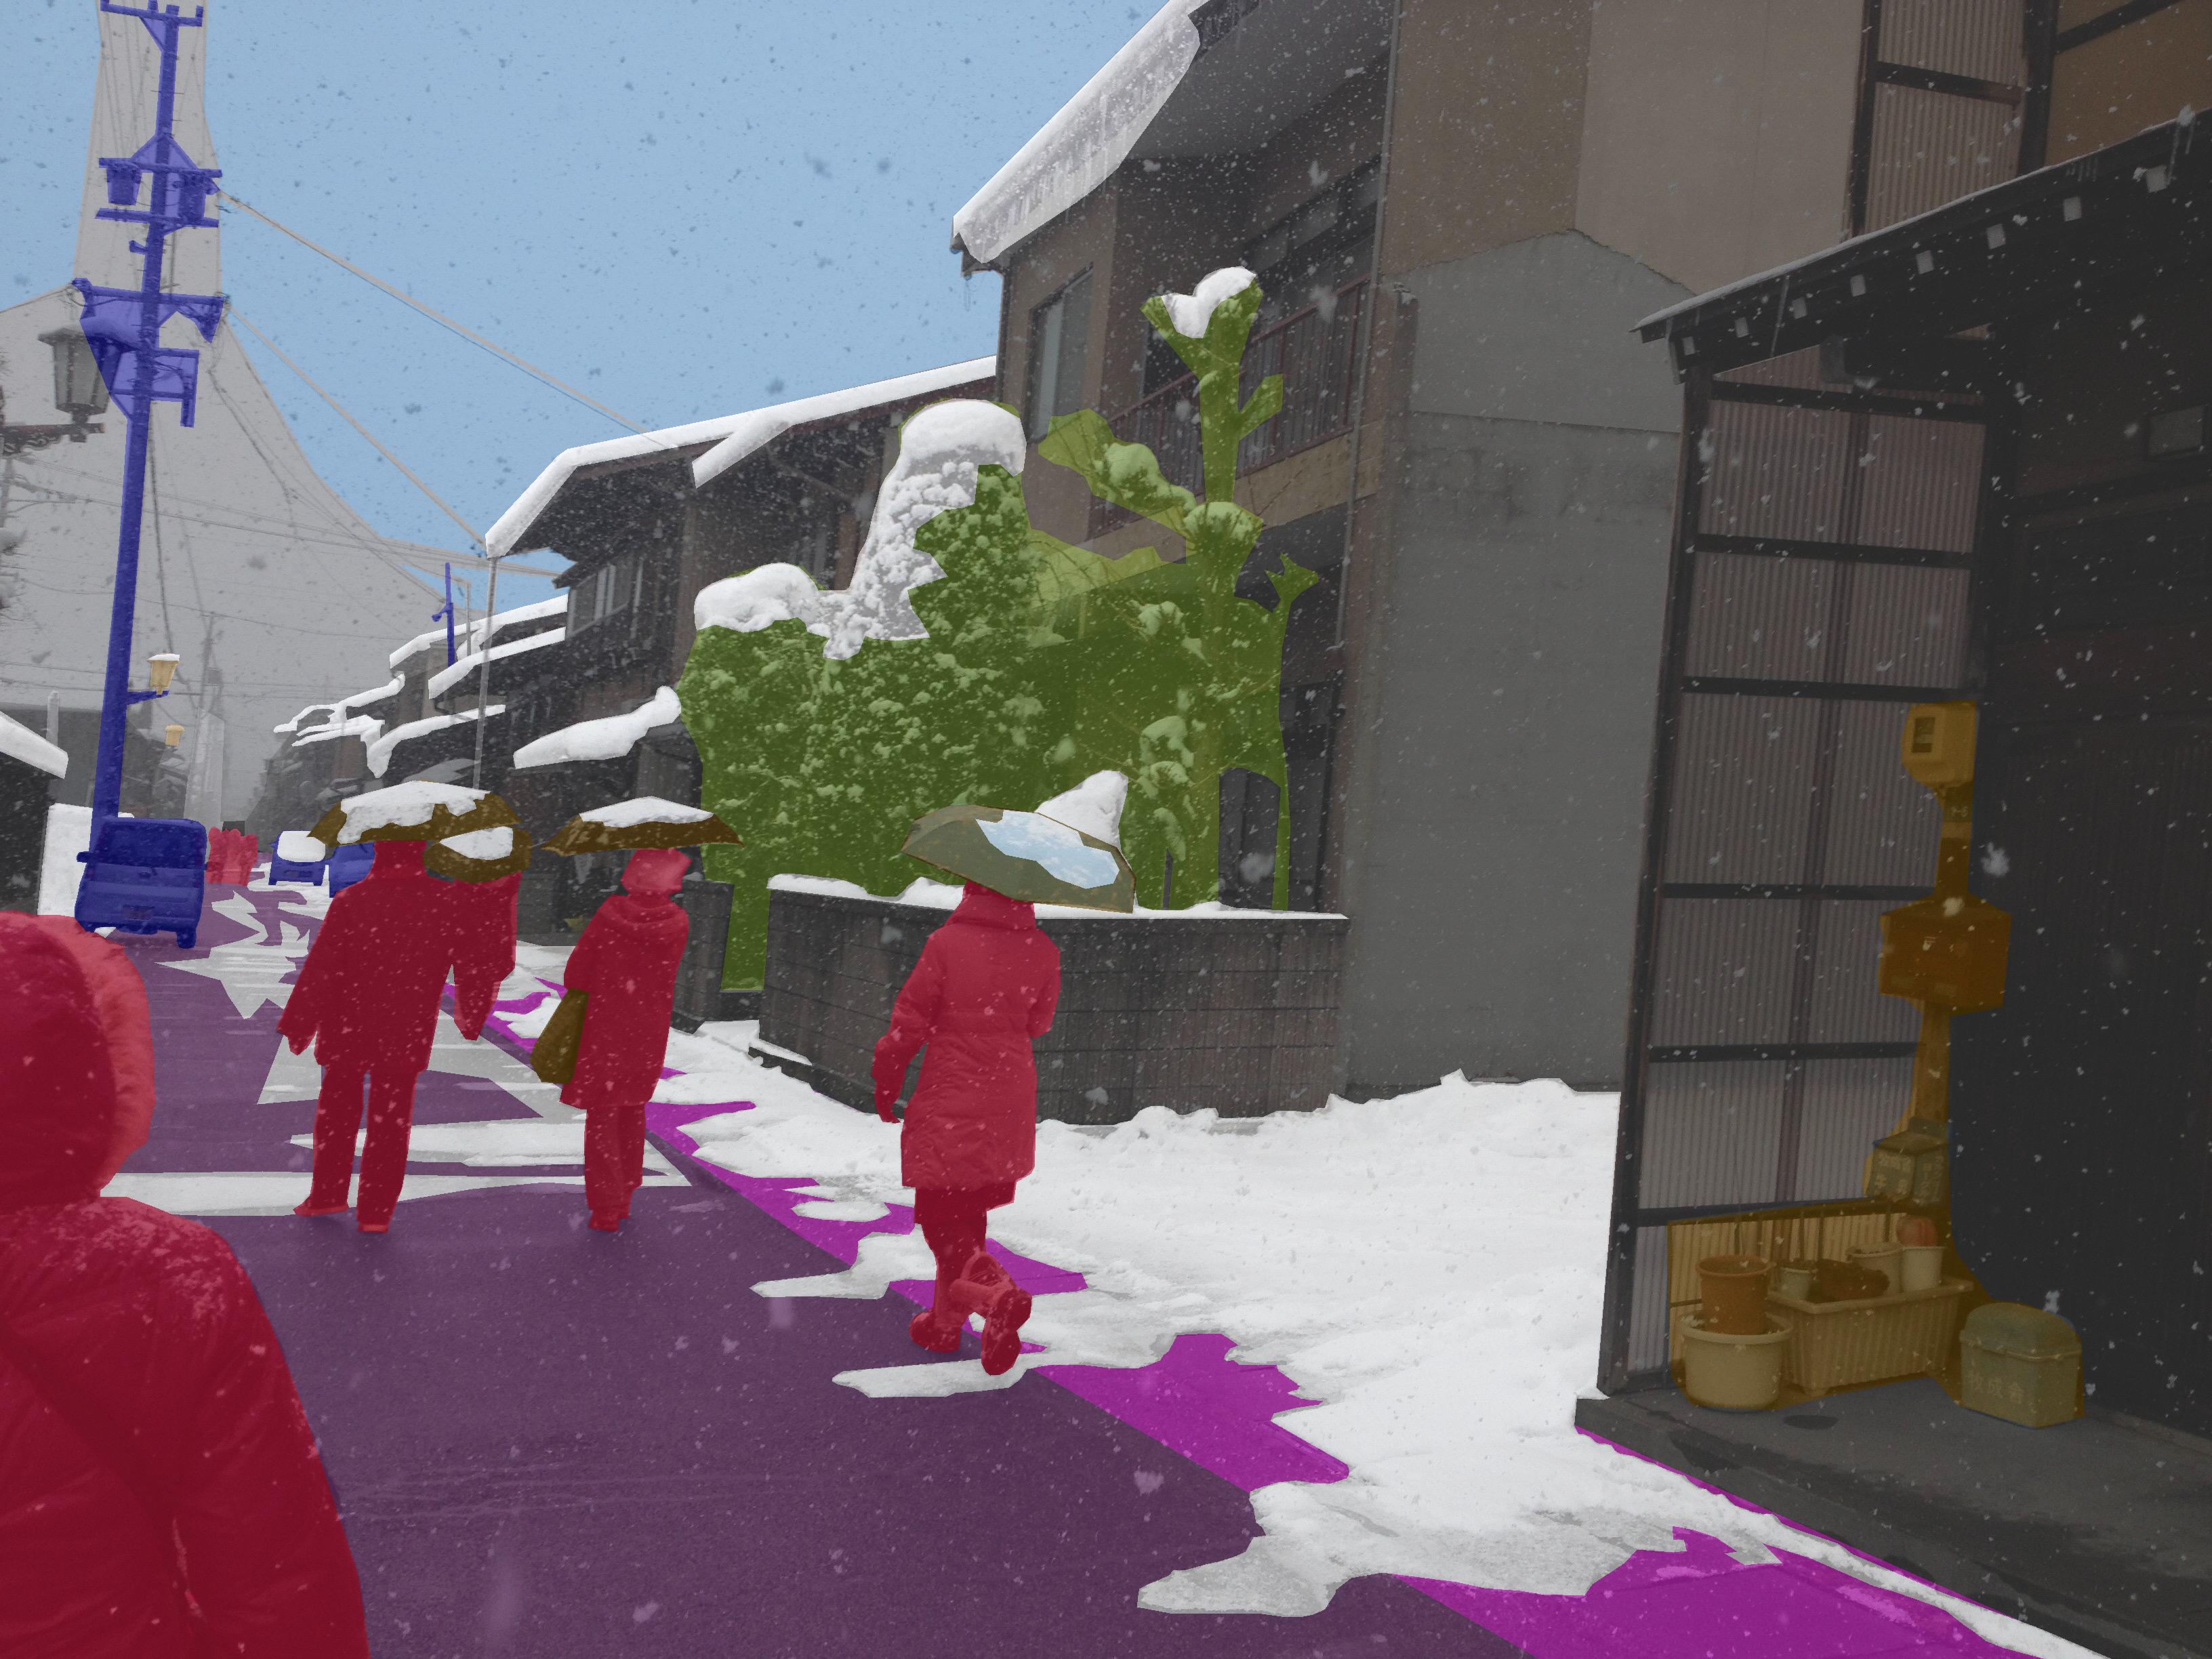

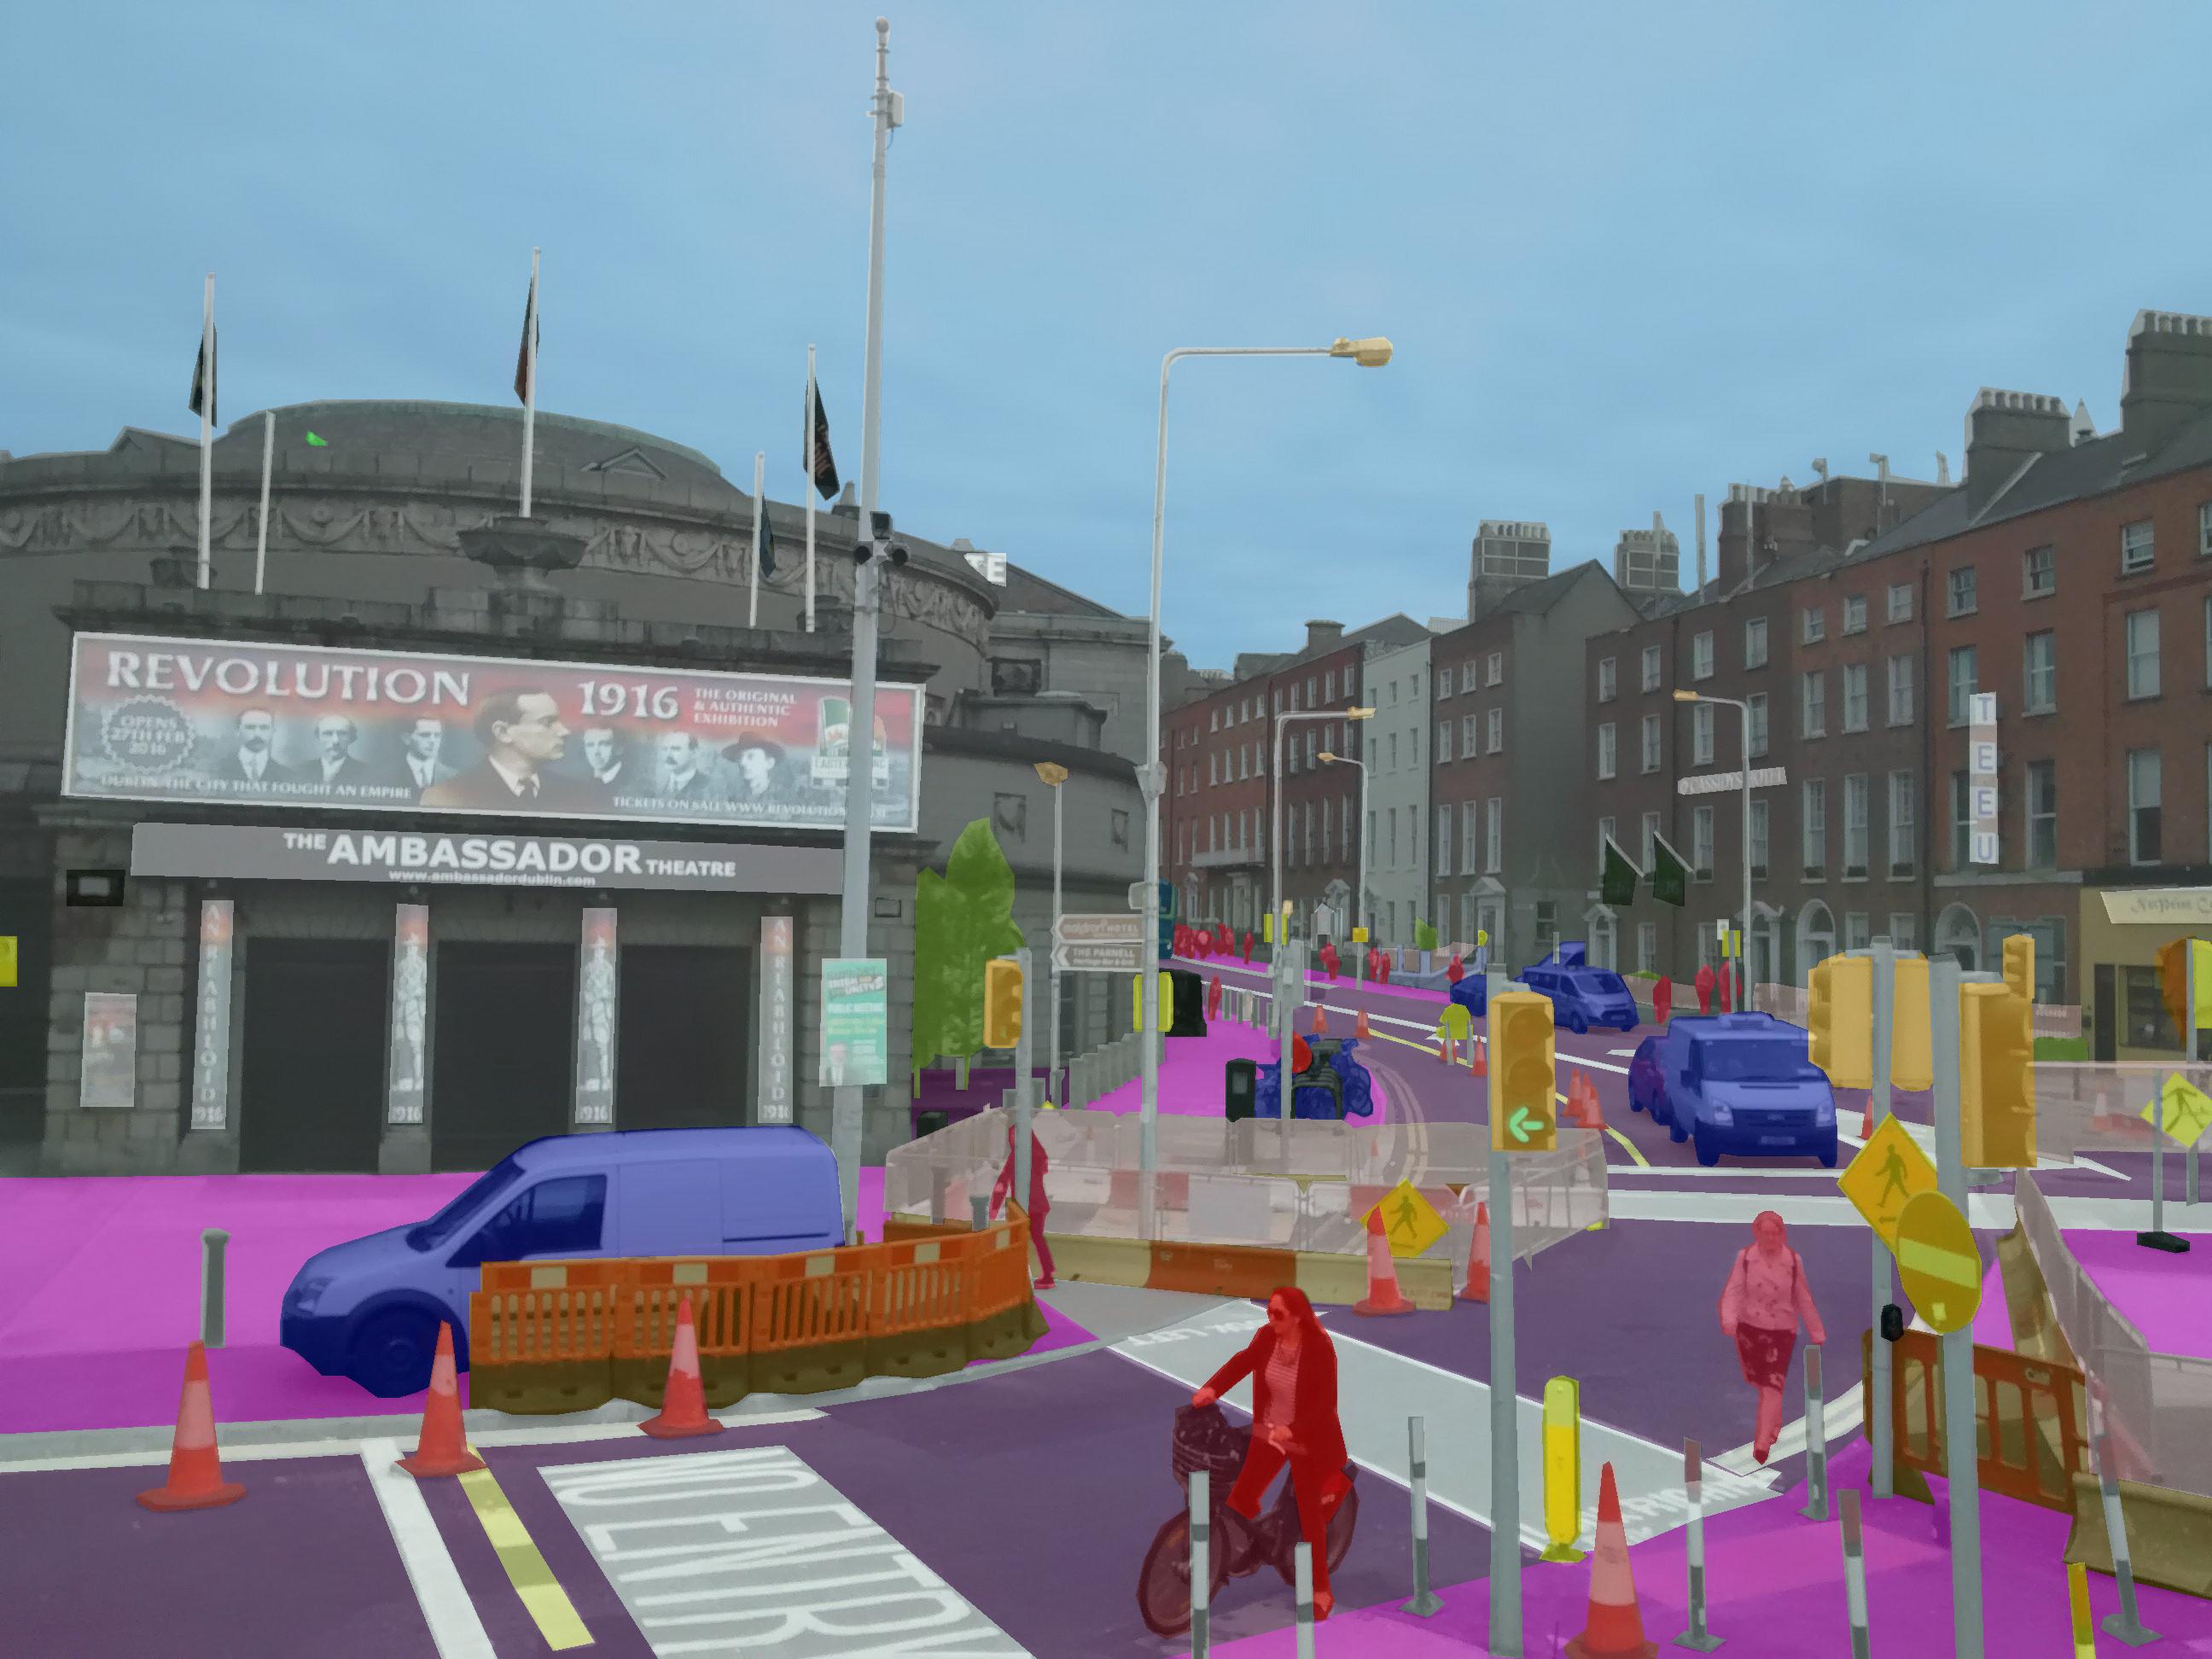
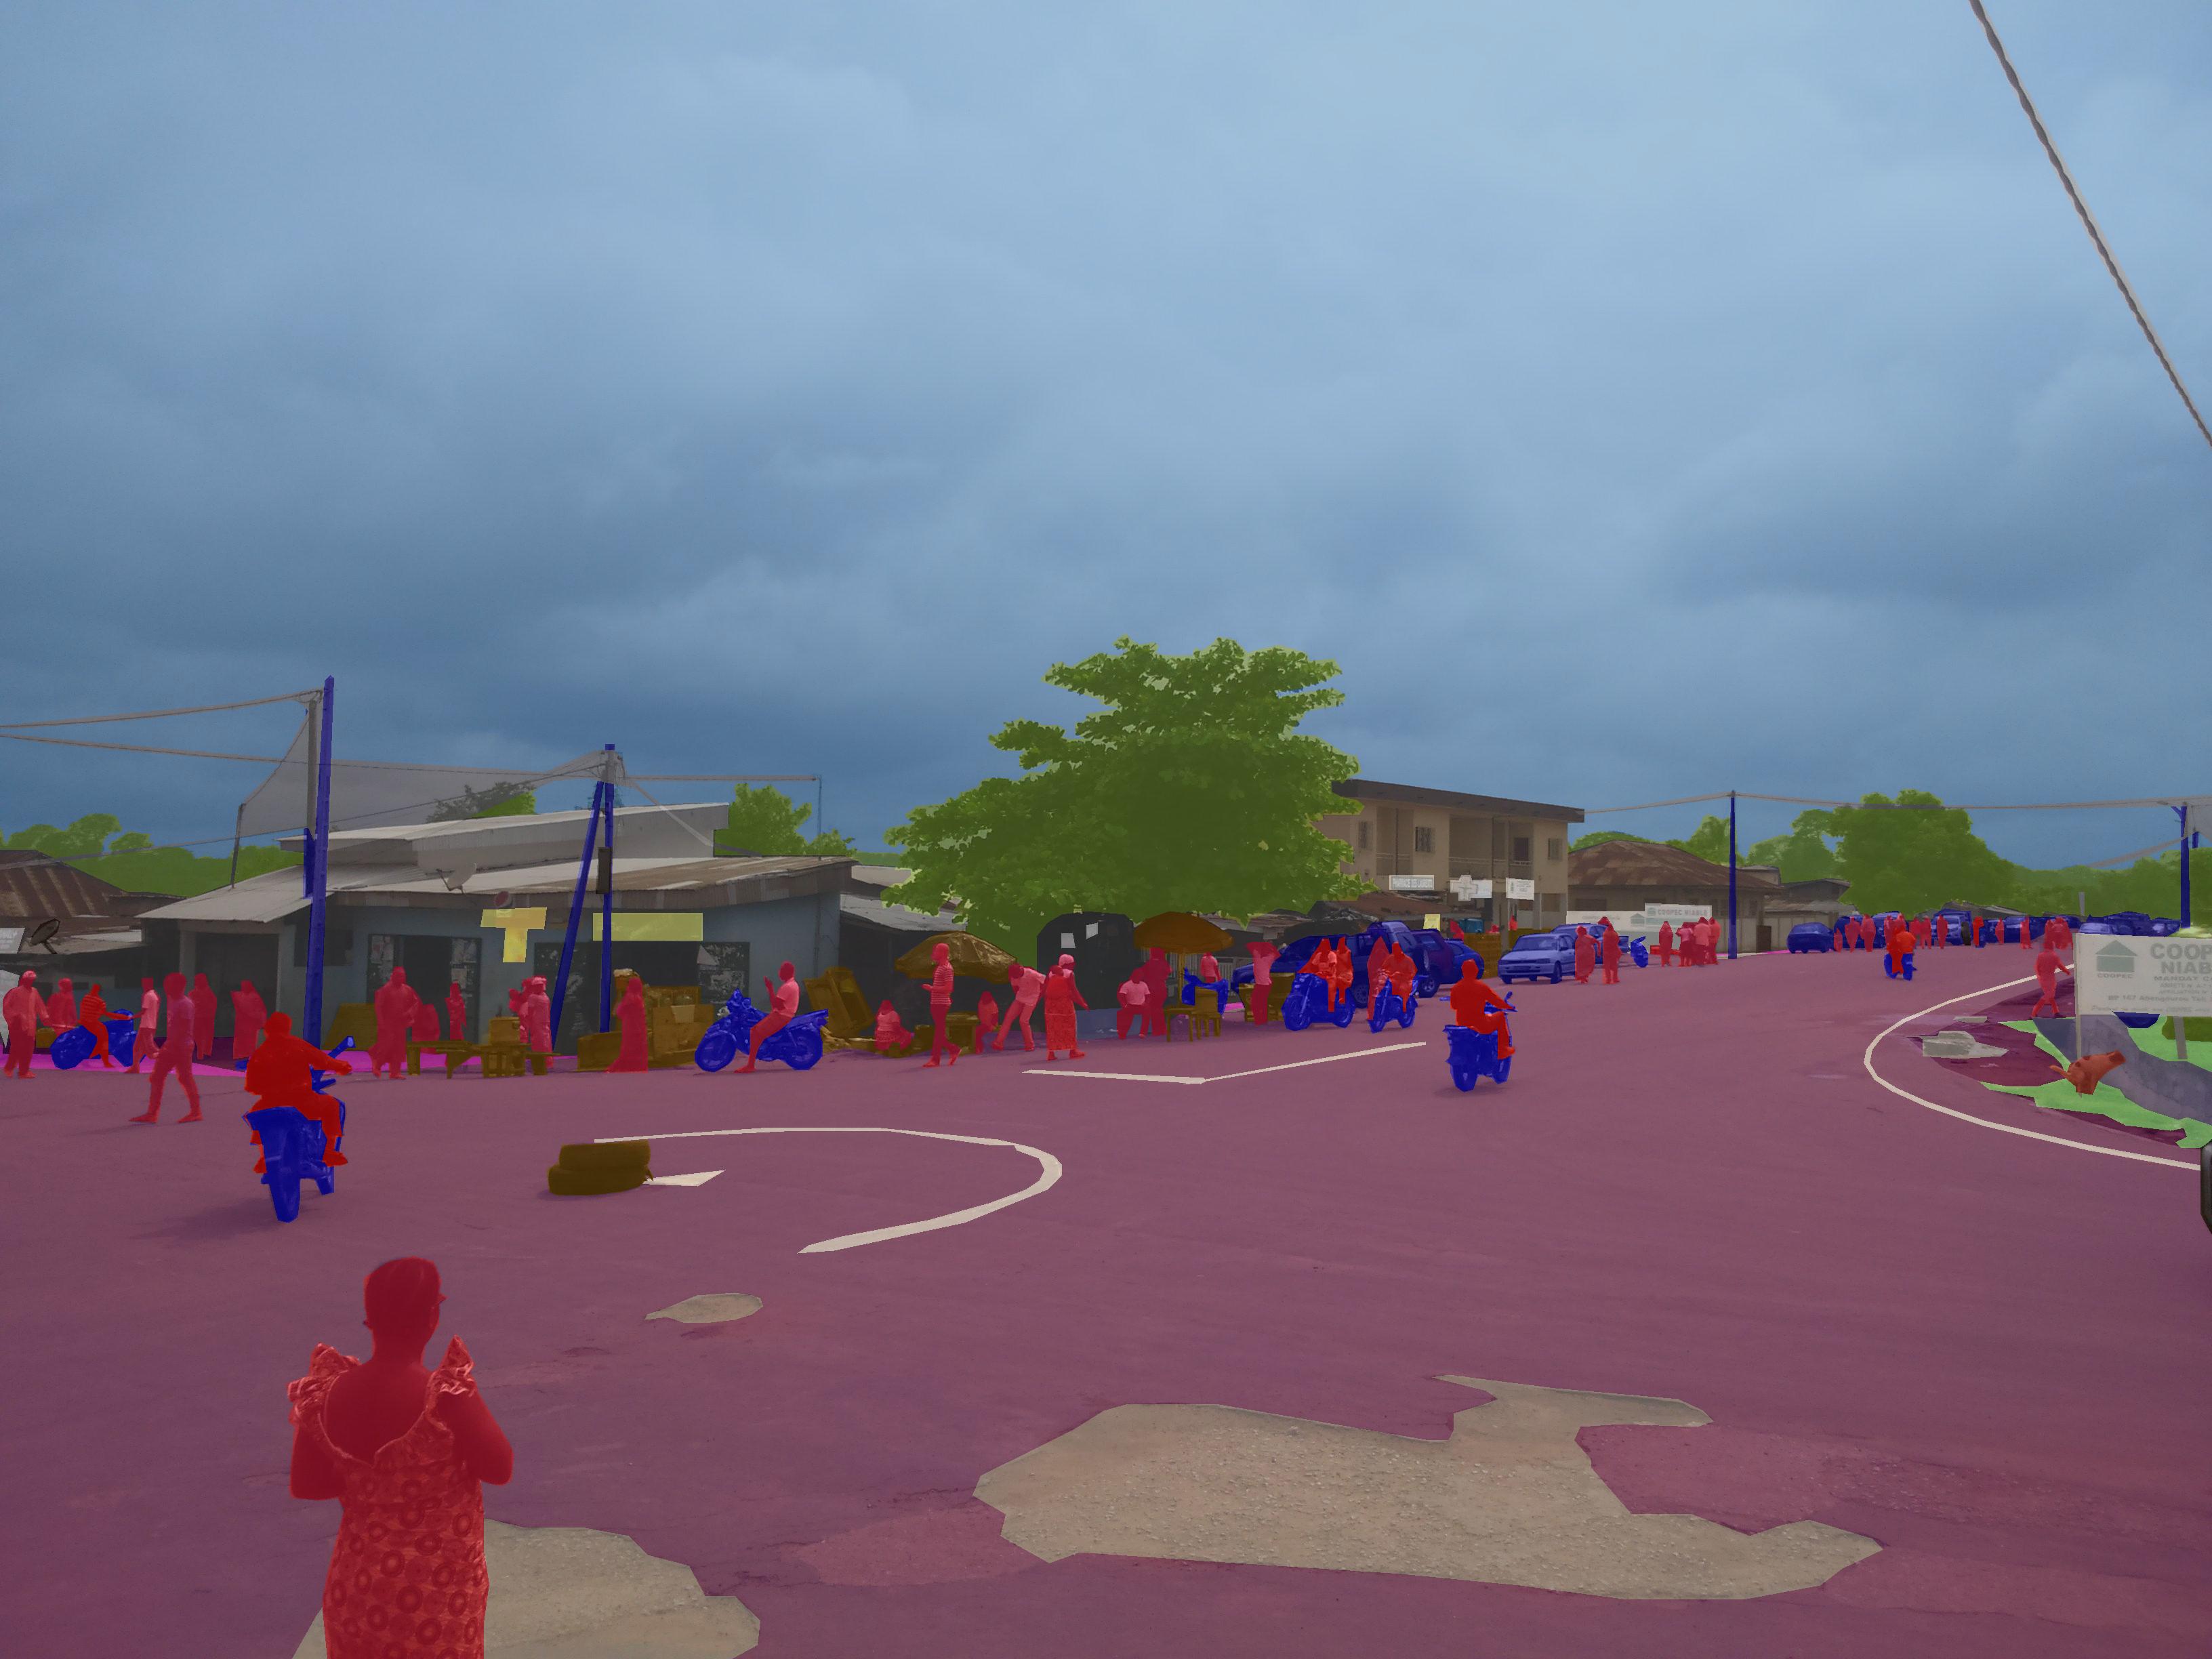
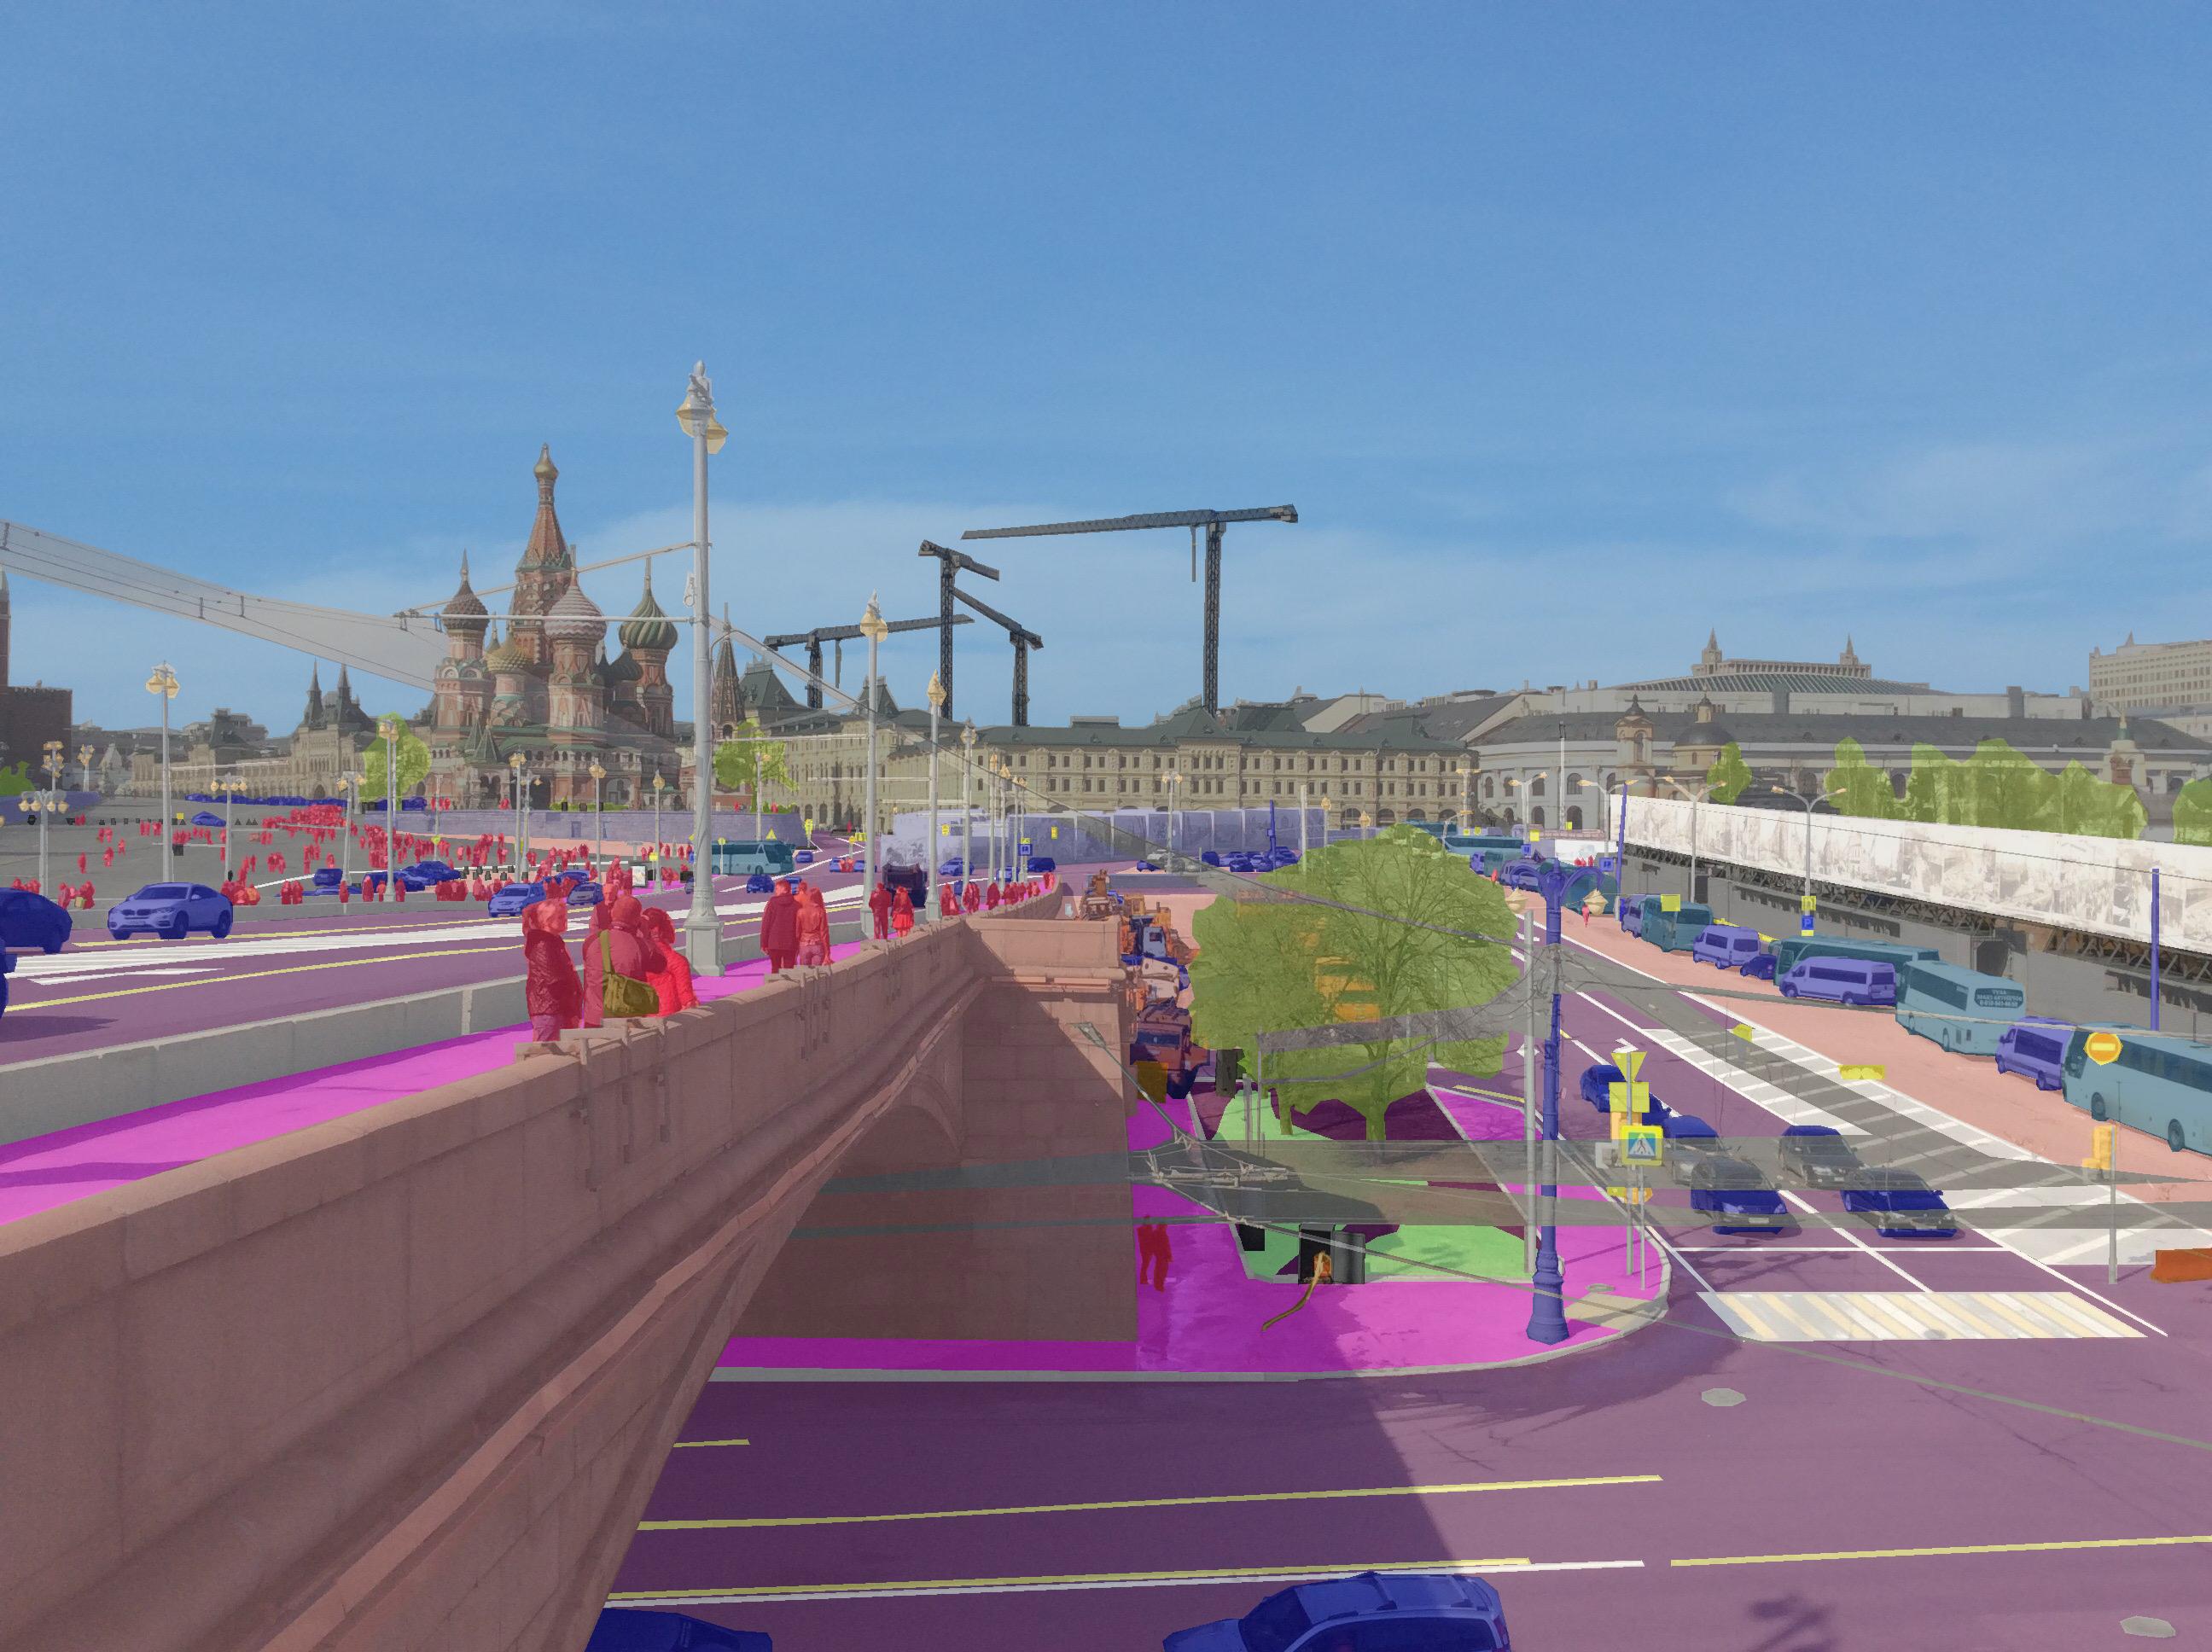
Pixel-wise, instance-specific annotations from the Mapillary Vistas Dataset (click on an image to view in full resolution)
Since we started our expedition to collaboratively visualize the world with street-level images, we have collected more than 130 million images from places all around the globe. While this number keeps growing at a frantic pace, we are putting serious efforts into researching, implementing, publishing, and releasing smarter computer vision models that can help us understand the semantics within this data.
As stated in an earlier blog post, we keep advancing supervised deep learning models as our primary workhorses to extract information that is valuable to our community and improve our products. However, such models are inherently hungry for data—and in particular for a lot of precisely annotated data.
This is where the Mapillary Vistas Dataset comes into play—a dataset that we have designed and compiled to cover diversity, richness of annotation detail, and geographic extent. We are proud to provide images with corresponding, pixel-accurate, and instance-specific annotations at an unprecedented scale:
25,000 high-resolution images (split into 18,000 for training, 2,000 for validation, 5,000 for testing; at an average resolution of ~9 megapixels) with pixel-wise annotations from >2 million manually drawn polygons
100 object categories, 60 of those instance-specific (i.e. to enumerate objects)
Global geographic reach, covering North and South America, Europe, Africa, Asia, and Oceania
High variability in weather conditions (sun, rain, snow, fog, haze) and capturing times (dawn, daylight, dusk, and even night)
Broad range of camera sensors, varying focal length, image aspect ratios, and different types of camera noise
Different capturing viewpoints (from road, sidewalks, and off-road)
The Mapillary Vistas Dataset enables us to build the next-generation street-level image recognition platform that is needed for autonomously driving cars, intelligent delivery robots, and smart city design projects. To this end, we can inventory street-level assets and objects in public spaces at a previously unseen level of detail and will provide this information for the benefit of everyone. Please take a moment to enjoy our early results on previously unseen test images below and by following #MapillaryVistas on Twitter and Facebook.

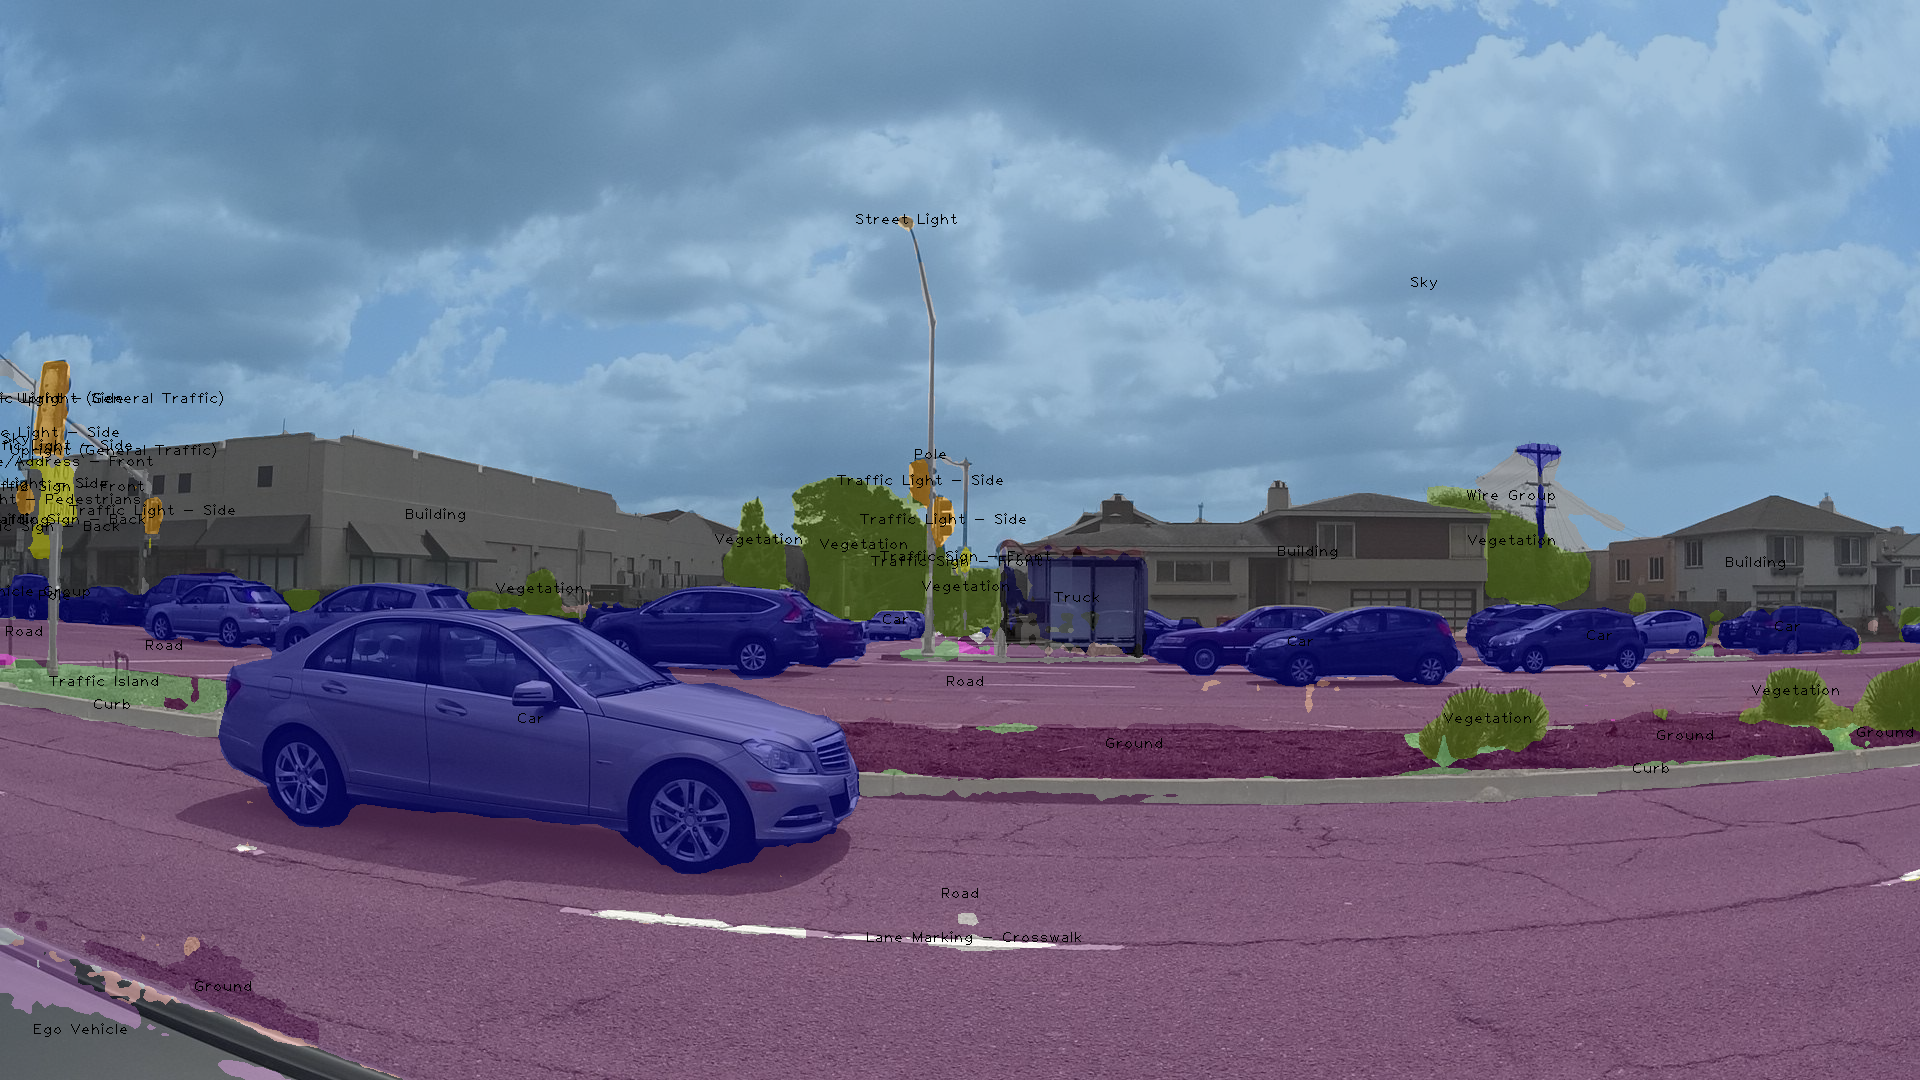
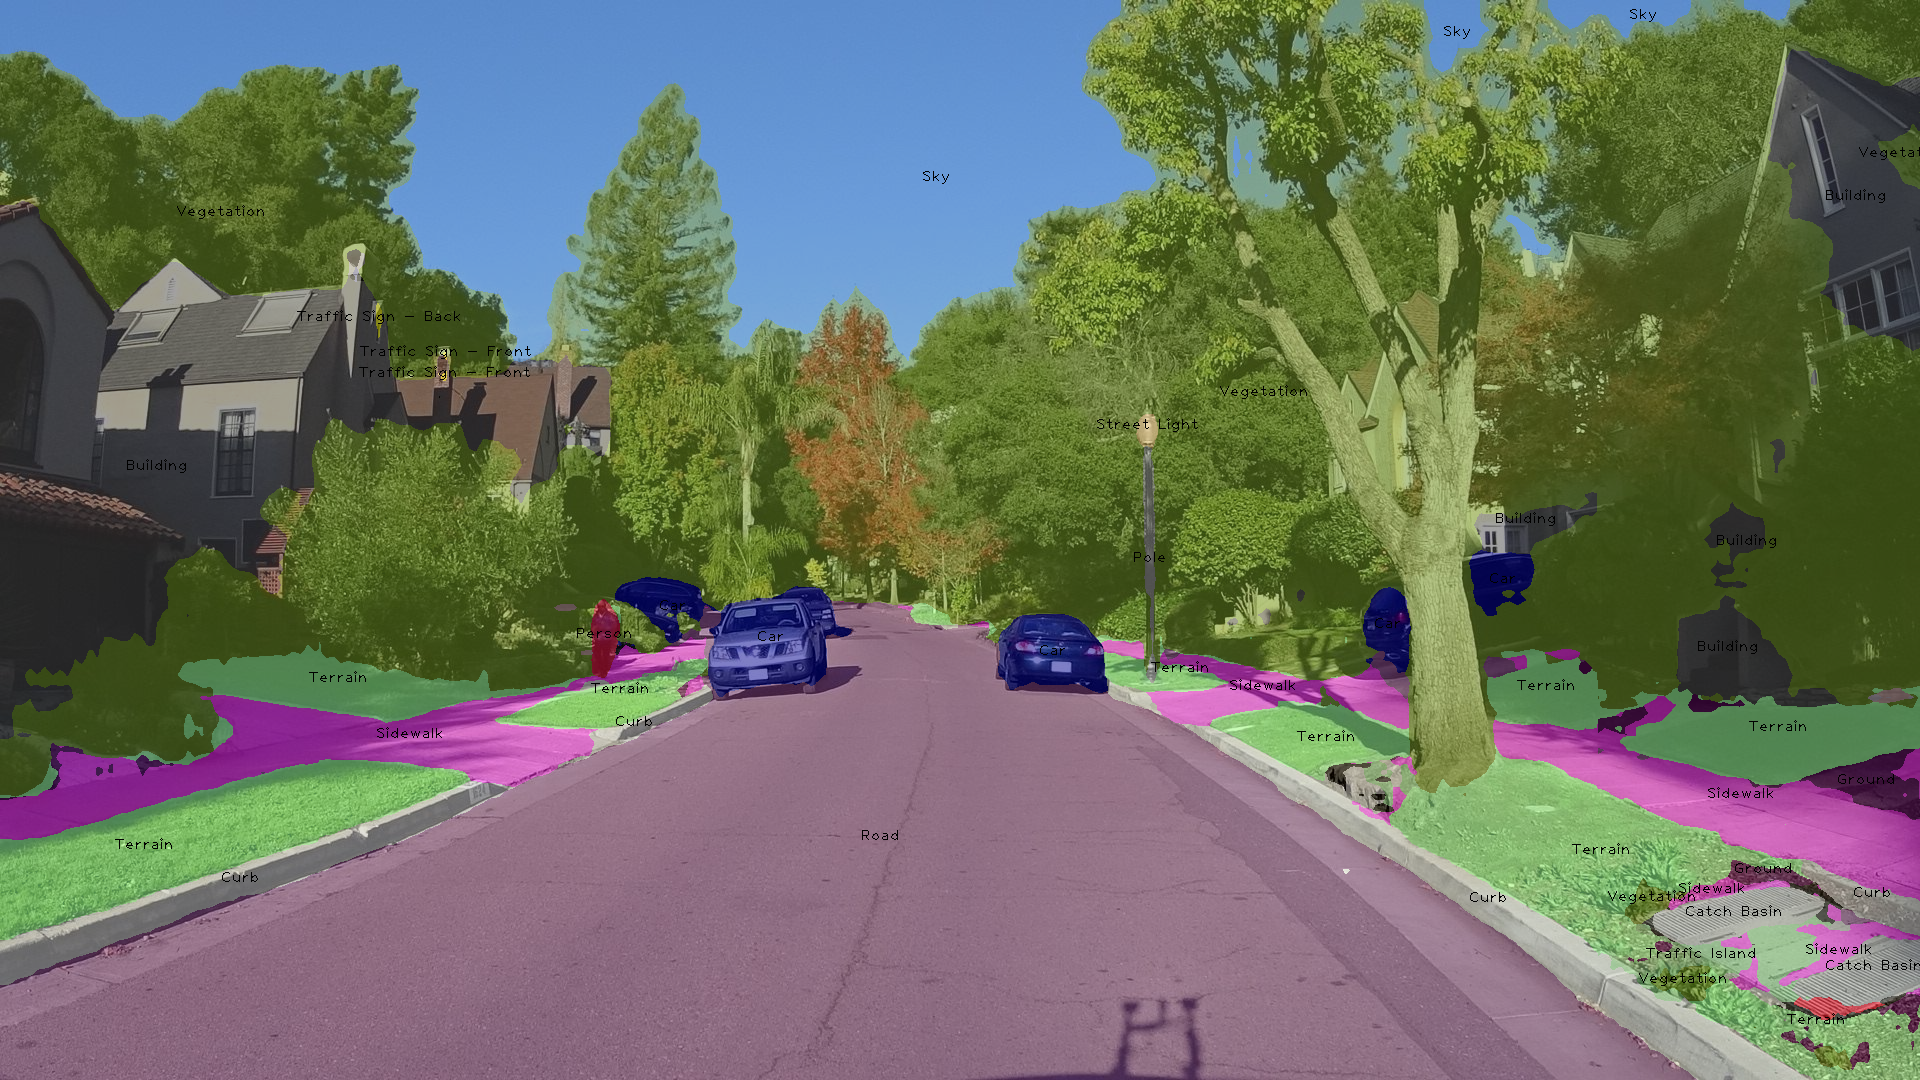
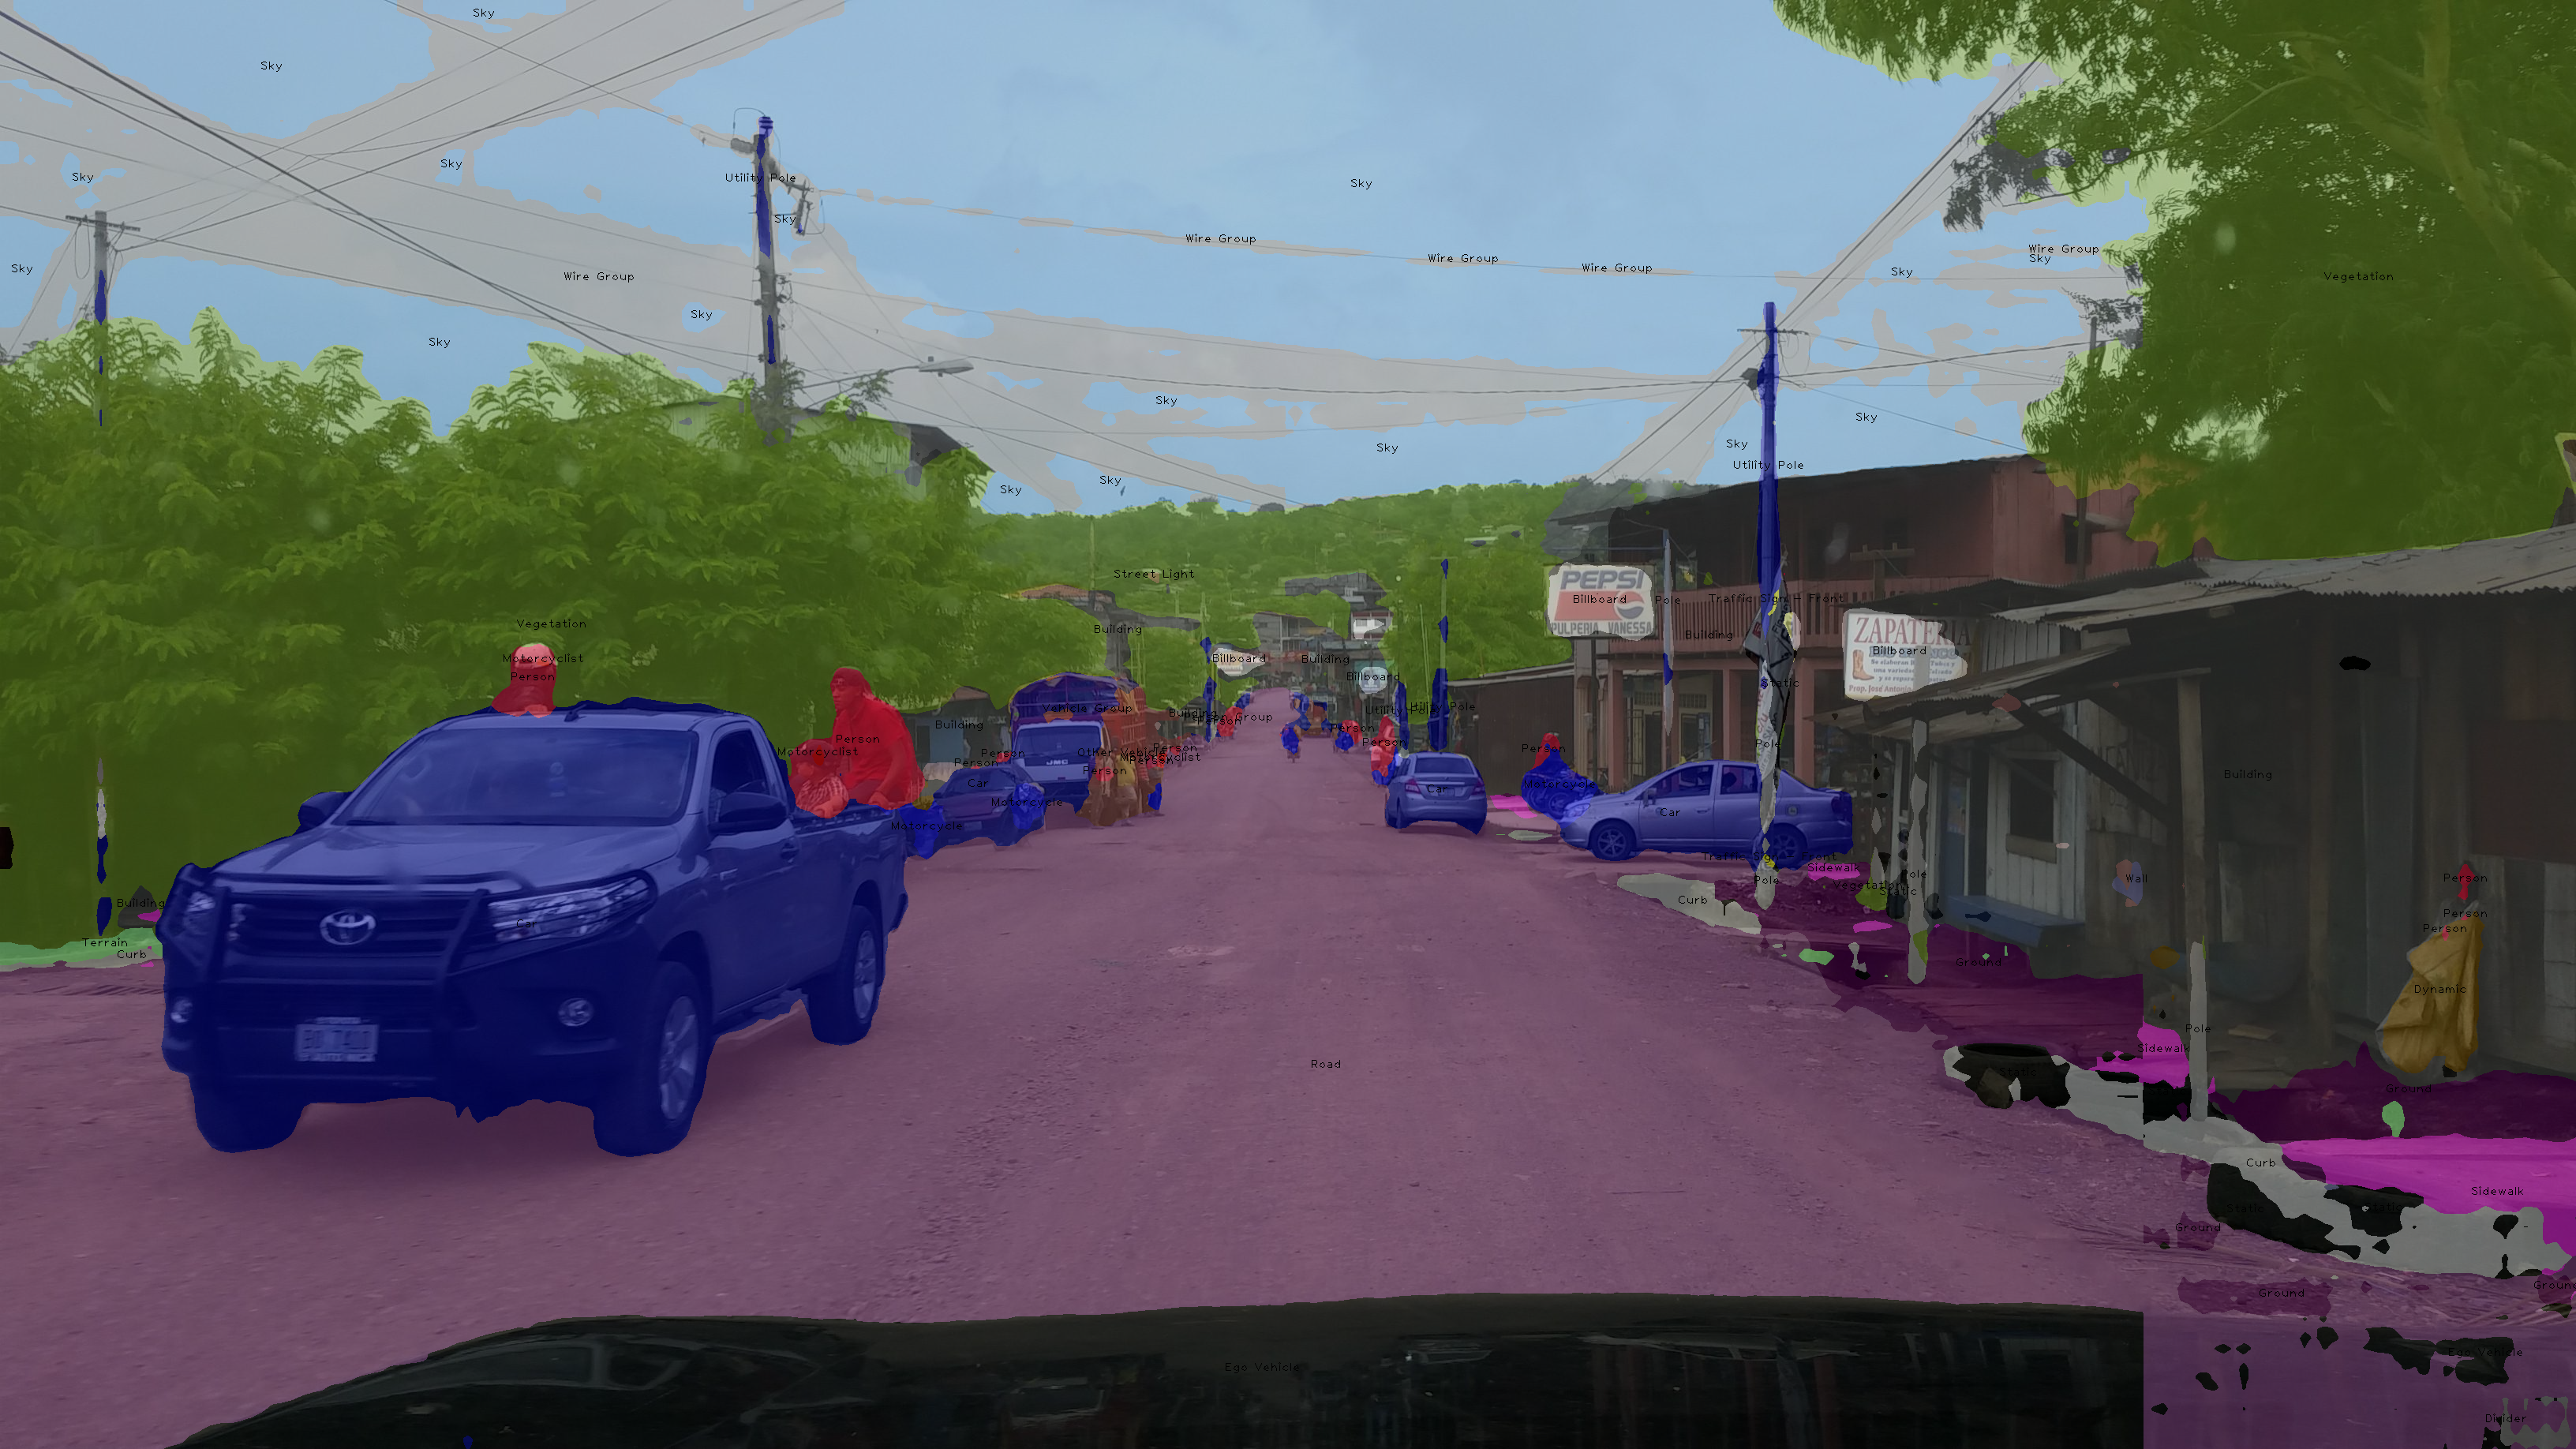
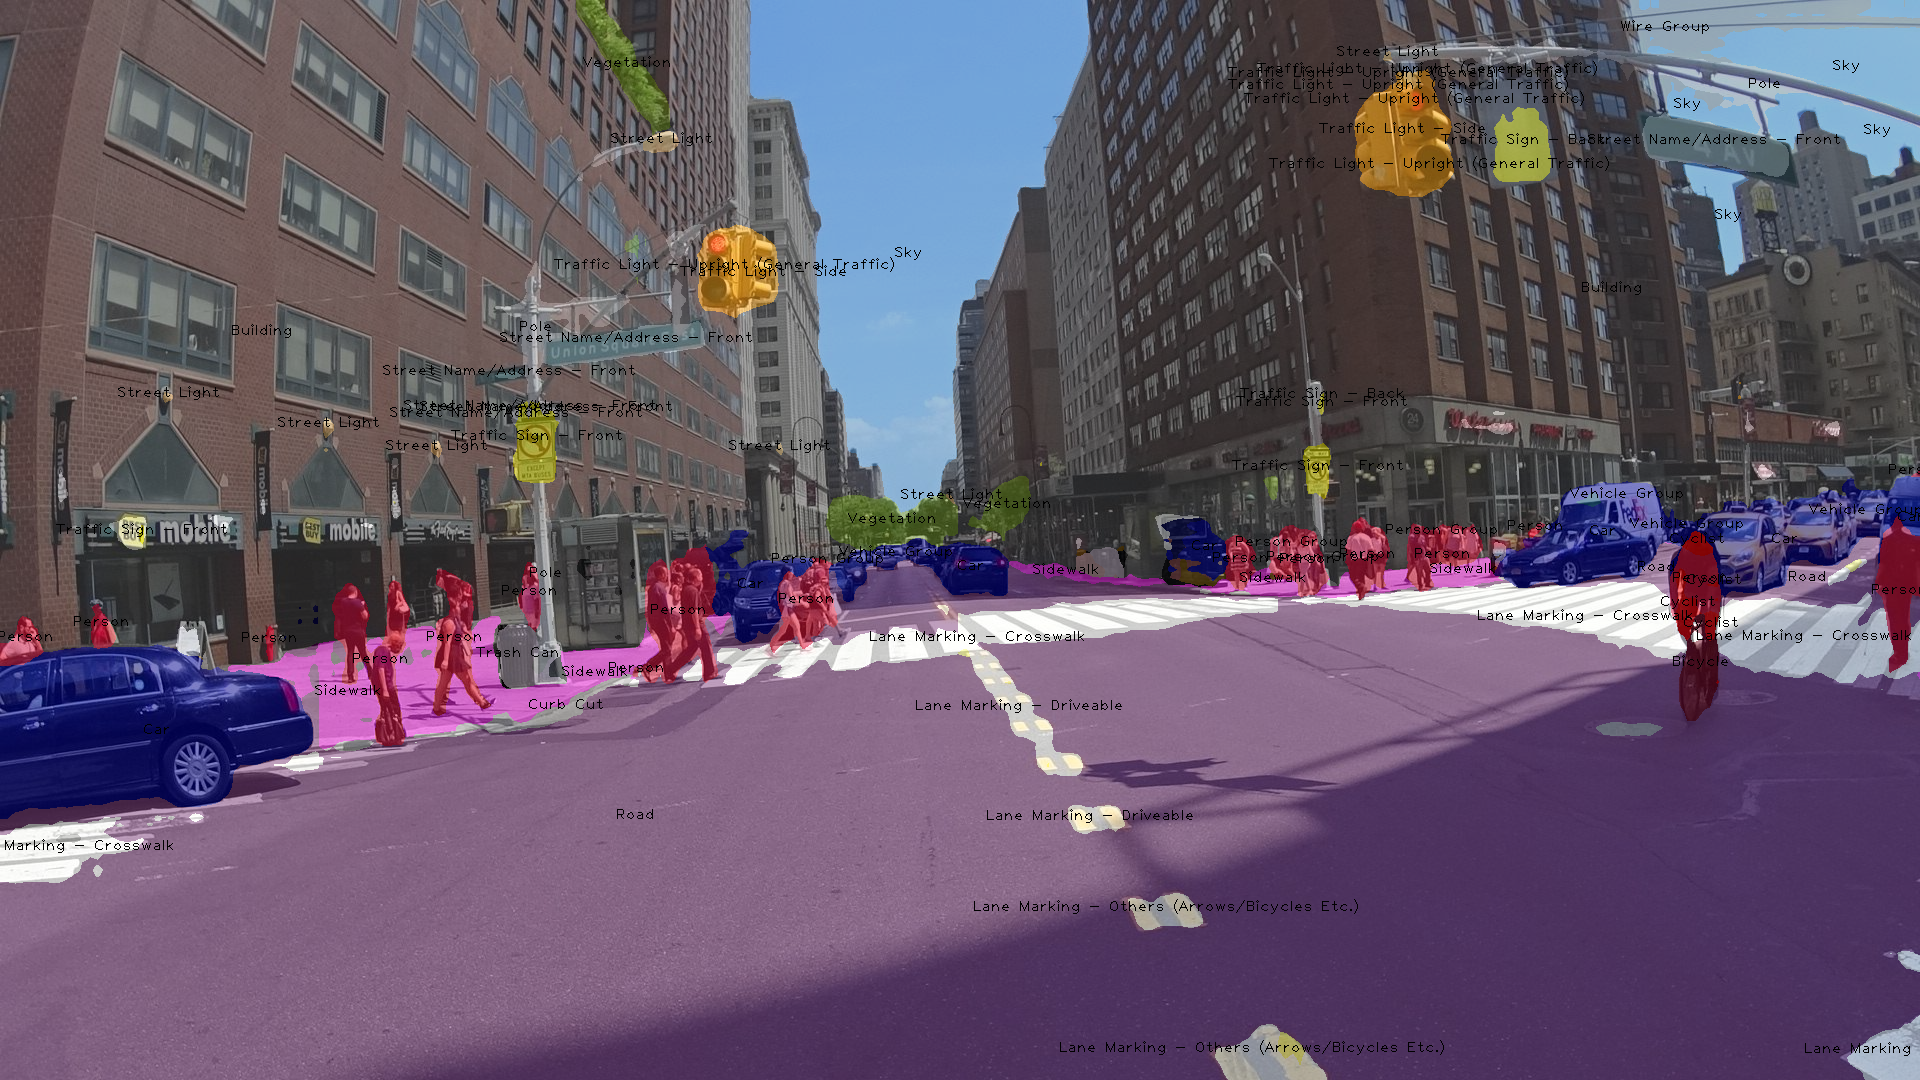
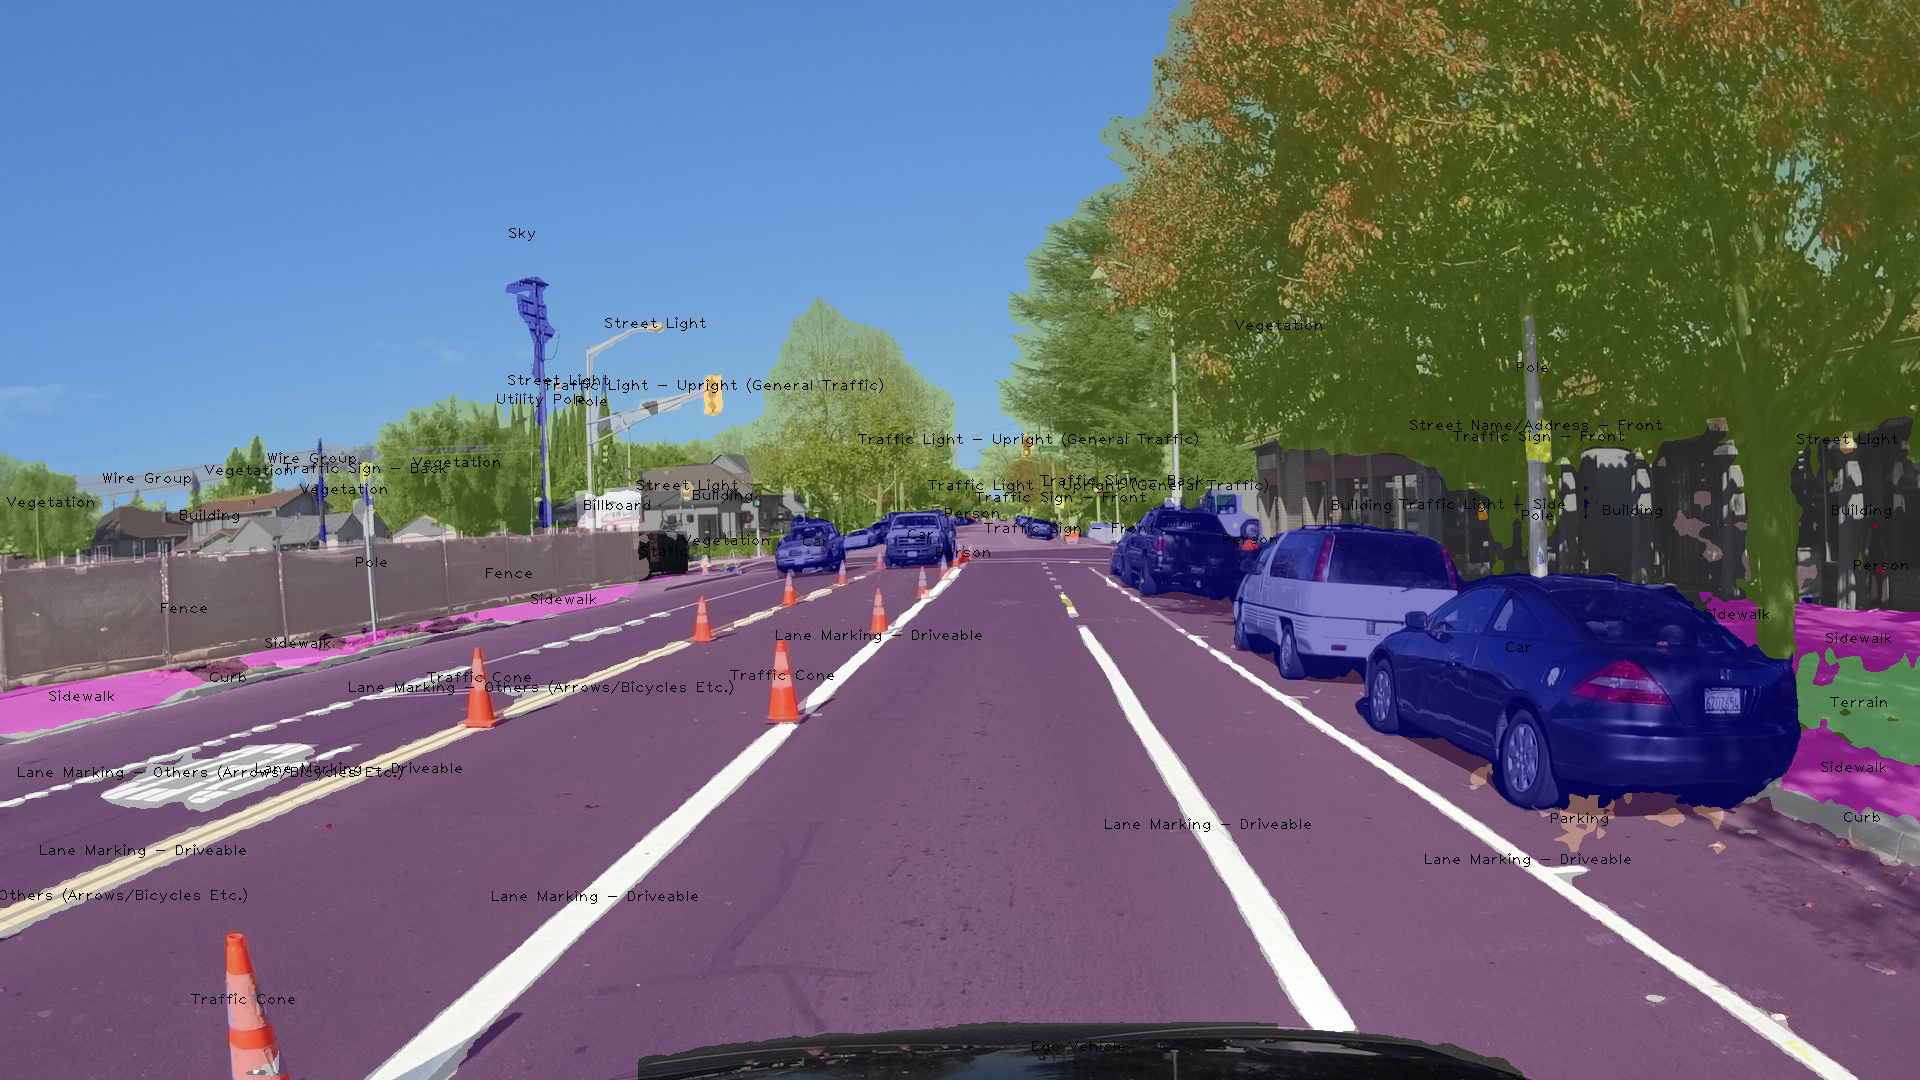
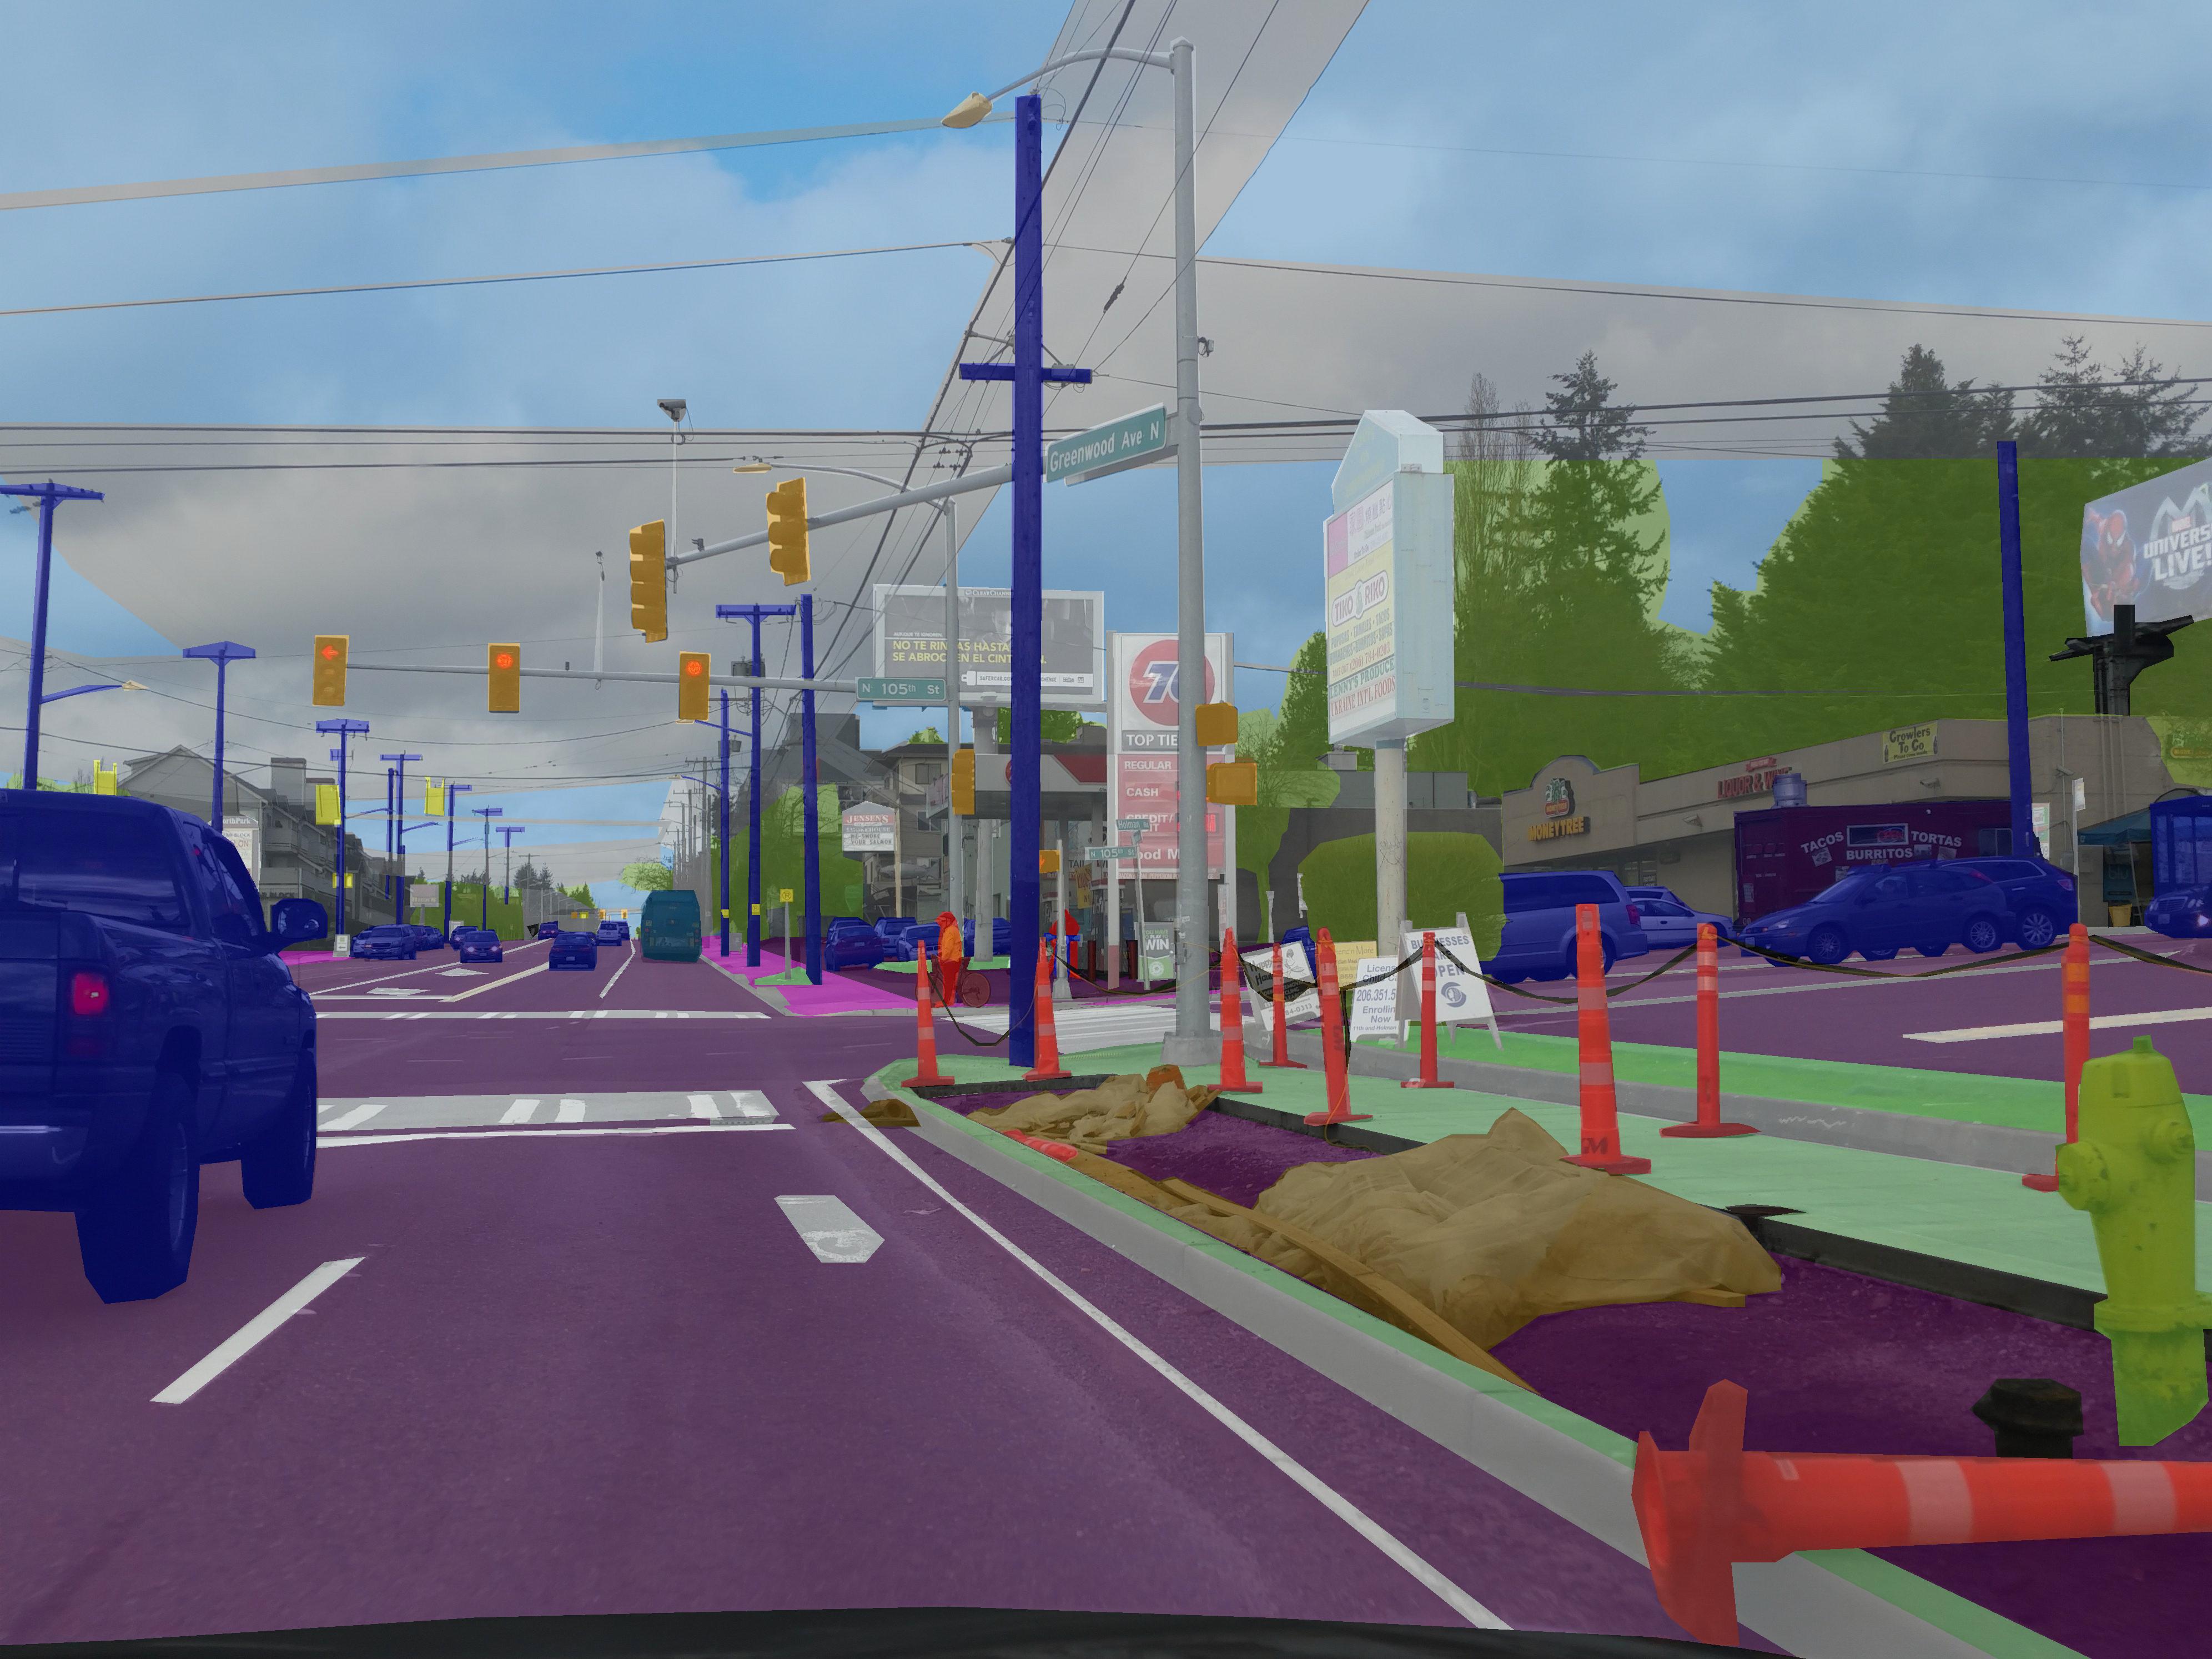
Image recognition examples trained on the Mapillary Vistas Dataset (click on an image to view in full resolution)
More statistics
Here are some statistics for a subset of 10,000 images, which illustrate how our data is organized in terms of label taxonomy and plot the numbers of individually annotated objects. For example, this subset contains ~100,000 individually labeled column poles and >70,000 cars, demonstrating the plurality of individual objects our machine intelligence is able to learn from.

When it comes to the geographic extent of the data, the following plot indicates how we have sampled our database to provide representative imagery across the globe. The resulting distribution is a strong indication that the images in the Mapillary Vistas Dataset are very diverse in terms of appearance for their object categories, making it another distinctive feature.

Next, let us put our dataset in perspective with what is already available in the research cosmos and most related to our dataset. Among others, it was the fantastic Cityscapes benchmark that inspired us to push the boundaries for street-level imagery datasets. Below you can see a comparison of the distribution of images (for the whole dataset, with a logarithmic scale on the y-axis) with respect to the density of annotated objects per image. These object categories comprise all the classes shown before, e.g. cars, motorcycles, traffic signs, traffic lights, poles, guardrails, etc.

Some notes on dataset annotation quality
One of the most critical aspects for a benchmark dataset is to ensure the quality of data annotation. Clearly, the goal is to obtain the highest possible annotation accuracy but what are the key metrics to track and how can we try to optimize them?
To improve the annotation quality for each of our object classes and in order to draw probabilistic conclusions about the overall dataset annotation quality, we developed a 2-stage quality assurance (QA) process, where the second stage is guided by Bayesian statistical modeling.
We are targeting object-specific annotation accuracies of >=97% for both precision (how accurately is an object delineated) and recall (how much of a specific object instance was found and annotated at all), which we eventually express via a variant of the so-called Jaccard index. The first round of QA is applied to each image and is conducted as a follow-up step after initial annotation to correct for potential mislabeling. The person conducting QA is different from the initial annotator but reports back major issues to them for improving the initial annotation quality.
The second stage comprises a QA protocol based on which we can infer, with a confidence level of 99% and a given sample of validated images and corresponding instances, whether the annotators will fail or succeed to provide us with correctly labeled data (i.e. individual Jaccard index scores >=97%), or if we need to increase the sample size to draw conclusions at this confidence level. In other words, for a given number of images and object instances we are testing, our stage-2 QA model can tell us with 99% confidence either that the annotators will fail or succeed to deliver the desired annotation quality, or that we need to send more data to stage-2 QA in order to draw such conclusions.
While this may seem like an academic discussion at first glance, it is in fact very practical and helps us draw precise conclusions about the overall dataset annotation quality at a given budget.
How to get the data and where to benchmark your results
Accessing and browsing through the Mapillary Vistas Dataset will be available on our brand new research website at research.mapillary.com, where you can also get to know our Research and Computer Vision teams, and find our latest publications and code. Please register for downloading our dataset now to make sure you will be among the first to get access in mid-May 2017.
Our dataset is also the basis for the Instance-specific Segmentation of Street-level Images task in this year’s CVPR Joint Workshop on Scene Understanding and LSUN Challenge as part of the LSUN’17 challenge. We are very much looking forward to your contributions and will announce the winner on stage at CVPR in July in Honolulu, HI.
/Peter and the Research & Computer Vision Teams