A Startup Dashboard with Google Spreadsheet
When you are a startup, you don't have much time. In our case, we want to track some of our KPIs, as the numbers of users, images and power users over time (lots of other historic KPIs like user retention too, but that's another blog). We also want have a nice dashboard but not build a system for that.

Since we needed a JSON API call anyway, we decided to implement a sliding backwards-scale JSON endpoint that looks something like
{
    "date":["12/19/2013","12/26/2013","01/02/2014","01/09/2014","01/16/2014","01/23/2014","01/30/2014","02/06/2014","02/13/2014","02/20/2014","02/27/2014","03/06/2014","03/13/2014","03/20/2014","03/27/2014","04/03/2014"],
    "users":[104,109,112,113,121,131,152,164,185,198,215,574,738,786,843,956],
    "photos":[24889,28435,34919,36599,40255,43388,51790,60306,68490,74641,78413,91207,120284,138000,165583,192208],
    "sequences":[923,1034,1171,1228,1358,1471,1776,2085,2483,2729,3177,3907,5034,5729,6635,8019],
    "edges":[128752,140619,181738,217009,247674,284711,315260,462161,612369,874701,1127074,1268489,1808776,2232907,2829353,3508281],
    "uploading_users":[31,34,36,38,39,41,45,51,53,61,66,110,154,181,203,234],
    "uploading_users_10":[26,29,30,32,33,35,37,42,43,49,53,76,108,133,154,181],
    "uploading_users_100":[14,15,17,17,17,18,18,21,24,29,31,44,56,62,74,100]
}
Now, you can build your own visualization on top of this with authentication, Heroku hosting and so on. However, there is Google Spreadsheet and Google AppScript, an extremely powerful and productive combination. In our case, we added a script to a Google Calc spreadsheet to interpret the JSON response and return an array of cell values:
function fetchStats() {

  var url = "https://api.mapillary.com/xxx";
  var urlFetch = UrlFetchApp.fetch(url, null);
  //fetch the data (with a secret token or authentication)
  var json = JSON.parse(urlFetch.getContentText());
  var cells = [];
  for (key in json) {
    var values = [];
    values.push(key)
    for (var i = 0; i < json[key].length; i++) {
      values.push(json[key][i]);
    }
    cells.push(values);
  }
  //the resulting 2-dimensional cell range
  return cells;
}
Once we have this, we can simply have a cell with =fetchStats() and have a cell range filled in from the endpoint anywhere in the spreadsheet.
After that, diagrams and calculations are trivial. This could result in a spreadsheet like
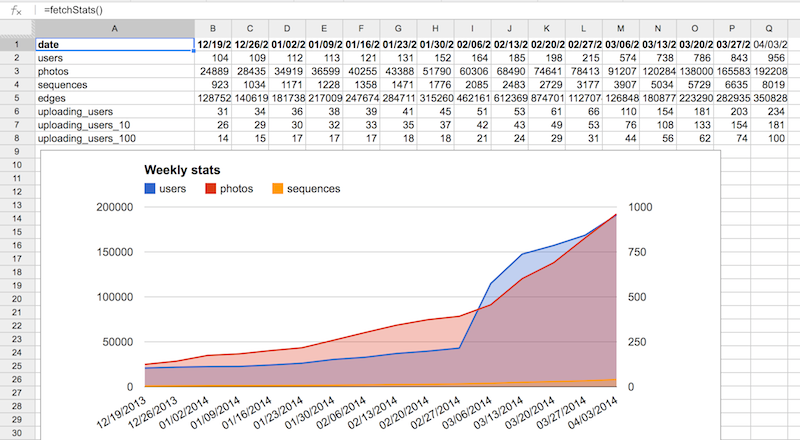
And we get the whole sharing, charting and other spreadsheet benefits instead of yet another system to maintain.
I like pragmatic - thought you might be interested.
/peter